

THE BOTTOM LINE
Another brief and shallow decline has served to re-invigorate demand enough to push the S&P-500 back into the zone of new all-time highs. However, the supply and demand indicator families of TATY, SAMMY and STERLING have not yet confirmed the S&P-500’s assault on new all-time highs, which casts a shadow on the longevity of the rally. While Santa has arrived early for investors, doubt remains as to how long he may linger?
SANTA ARRIVES EARLY
Last week’s update included this quote: “If the S&P-500 can maintain its uptrend line, then all these indicators will have done is to warn of a pause, which will likely re-invigorate demand”. Although volatility did increase substantially, the uptrend line was never breached (Screenshot-495), and by Thursday’s close the price, in impulse like fashion, had matched its previous intraday all-time high. So, once again the stock market has tantalized the bears, and then crushed their hopes that they have called a significant top. The problem with the bear case is not that it does not contain a long list of bearish measurements at extremes never before seen, but that liquidity in the global financial system is at even greater levels never seen before.
The classic definition of inflation is “too many dollars chasing too few goods and services”, and these days you can add pounds, pesos, euros, lira, yen, yuan, and rubles, all of which are seeking a reasonable return in global markets, inflating the price of financial assets in the process. So, it is “a lump of coal” for Christmas for the bears, and reward for investors savvy enough to reject, for now, the bear case compelling as it may appear. However, at some point the bear case will prevail, and likely with a vengeance given the extreme nature of the measurements on which the bear case is built, so the need for constant vigilance remains.
TATY — A REPRESENTATIVE OF A FAMILY OF STRATEGIC SUPPLY AND DEMAND INDICATORS

TATY is shown above in yellow with the S&P-500 overlaid in red and blue candle chart format. TATY finished the week in the red zone at the 144 level after dipping into the caution zone surrounding the 115-125 level, which completed the first step in a new “Big Chill” warning.


Although the S&P-500 has rebounded to match its previous all-time intraday high (Screenshots-494 and 495 above), TATY is still showing a negative divergence shown as a down sloping magenta line. If TATY begins to confirm new all-time highs by oscillating, and forming bottoms in the red zone, and tops near the blue zone surrounding the 160 level, then the bull trend will likely continue for weeks or months. However, if TATY issues the second half of a “Big Chill” warning by stalling out in, or near the red zone surrounding the 140 level, then the historic level of high risks represented by the bear case will remain, and likely increase. Obviously, this is a situation, which requires close observation.
SAMMY — A REPRESENTATIVE OF A FAMILY OF TACTICAL SUPPLY AND DEMAND INDICATORS

SAMMY is shown above in yellow with the S&P-500 overlaid in red and blue candle chart format. The rally back to new all-time highs remains unconfirmed by SAMMY, which has been negatively diverging ever since the February 2020 top yielded to the March 23, 2020, price bottom. The price marginally exceeded the steepest magenta dashed down sloping trend line during the surge back to new all-time price highs, but still left a yawning negative divergence in place, suggesting continuing atrophy in the balance of supply and demand driving the price. If the rally is to have legs, then SAMMY must begin to rally with the price, and soon; otherwise, the negative divergence, which suggests a weakened balance in supply and demand, may begin to weigh down the ability of the rally to continue.
STERLING — A PROTOTYPE REPRESENTATIVE OF A NEW FAMILY OF SHORT TO INTERMEDIATE TERM TRADING INDICATORS
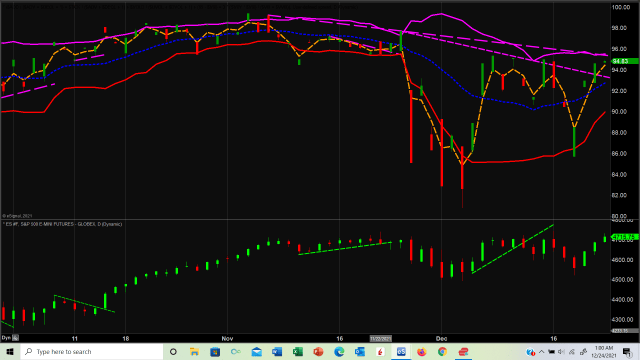
STERLING is shown above in the upper panel with the S&P-500 eMini futures contract shown in the lower panel. STERLING did rally with the price this past week, but still left a negative divergence in place after breaching the steepest magenta dashed down sloping divergence line, but failed to rally to the higher magenta down sloping negative divergence line. In like manner as SAMMY, this version of STERLING is suggesting that the balance of supply and demand is not yet confirming the rally in the price.

Above is another version of STERLING in weekly format, which shows in even more dramatic fashion the negative divergence between the rallying price and the diverging supply and demand indicator represented by the down sloping dashed magenta lines. So, the bulls are still in charge, but TATY, SAMMY and both versions of STERLING shown above are suggesting that the bull has likely arrived at new all-time highs in a state of fatigue after another brief and shallow decline, which served to re-invigorate demand.
The testing of this new family of trading indicators will continue into 2022, not because they are not working, but on the contrary, they are performing so well it is proving very difficult to cull down the list of candidates. This is exciting, but also frustrating given that each candidate indicator has its own unique and desirable nuanced appeal.
Please stay safe!
Regards,