

THE BOTTOM LINE
Families of both strategic and tactical indicators are beginning to suggest the current Santa Claus rally may be in need of a rest to reinvigorate demand, even though the big picture analysis remains favorable toward demand over supply. Investors should not be surprised if the stock market delivers a potentially swift and/or dramatic decline, which may be fleeting, and which may serve to reinvigorate demand. The aggravating thing about corrections is that they can sometimes turn into much more, and current highly elevated bullish sentiment at record, or near record levels, and with valuations also at extreme levels suggests at least the potential for a correction to turn into something more significant. We shall be monitoring changing conditions carefully, but in the interim we shall be making tactical trades as conditions allow in order to turn potential rising volatility into an advantage.
A Pause?
Lowry Research and other analytical outfits are showing data and metrics, which are favorable toward demand over supply. However, in our supply and demand indicators the growing negative divergences, both large and small, are beginning to suggest the rally back to new all-time highs is likely in need of a pause to reinvigorate demand. Negative divergences between the rising price, and the declining indicator(s), does not always result in the price weakening, and then beginning to follow the indicator(s) lower, but it is a very common relationship, which tends to work out a very significant percentage of the time. So for now we will simply say that the big picture remains favorable, and new all-time highs should not come as a surprise, but negative divergences in both families of strategic and tactical indicators suggests that investors should be aware that a period of weakness may be needed to reinvigorate demand.
TATY — A REPRESENTATIVE OF A FAMILY OF STRATEGIC SUPPLY AND DEMAND INDICATORS
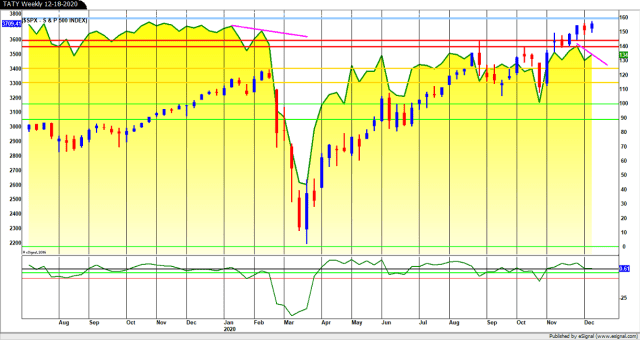
TATY finished the week at 134, and is shown above in yellow with the S&P-500 overlaid in red and blue weekly candle chart format.
I have drawn in the negative divergence with down sloping magenta lines, which developed between the price and the indicator in the run up to the February high, and the current developing negative divergence between the price and the indicator, which recently flashed a “Big Chill” warning by declining into the caution zone surrounding the 115-125 level, and then touching into the red zone surrounding the 140 level, where for the time being the indicator has been turned back. This kind of indicator sequence, or gymnastic type chart action, has preceded significant and/or major tops in the past, and rebound tops during major bear market rallies, hence the title “warning”. The “TATY Tops” chart from a 2014 presentation I gave at St. Simons Island is shown above and depicts (red ellipses) the declines following “Big Chill” warnings. Please note this sequence happens not only at bull market tops, but during significant rebound tops during bear markets.

Given the evidence of firm and expanding demand in the Lowry research definitions of demand, I am suspicious that the negative divergences in our supply and demand strategic and tactical indicators may only yield a period of correction to reinvigorate demand. This would also fit the positive seasonal tendency for the stock market to rally from roughly Halloween to Easter over the last one hundred plus years. Of course conditions can, and do change in markets, so the current outlook for a correction could change into something more serious, as the market generates more supply and demand information about the ever changing balance between the two forces. We constantly monitor the balance of supply and demand, and if it signals the balance is changing significantly then we will alert clients with an interim update. For now the information available from our indicators is suggesting there may be an interruption to the current Santa Claus rally.
SAMMY — A REPRESENTATIVE OF A FAMILY OF TACTICAL SUPPLY AND DEMAND INDICATORS

SAMMY is shown above in Screenshot-188 in weekly format, and in Screenshot-189 in daily format.

Screenshot-188 shows SAMMY negatively diverging with the price as the February all-time high topped out, and then gave way to the swiftest decline to 20% down from an all-time high in history. The negative divergence is shown by the dashed magenta line. An even bigger negative divergence has been under construction since the February high, and is shown by the down sloping orange dashed line, which has remained in place even as the price has been in a relentless, but ragged rally off the March 23 low.
The failure of TATY and SAMMY to lead the price higher off the March 23 low has been, and remains, a matter of serious concern, as this is completely atypical and abnormal behavior for these families of supply and demand indicators. This atypical and abnormal behavior has been suggesting the overall health of the post March 23 rally is not as strong as the recovery rally off the March 2003 low, or March 2009 low for example. Obviously in terms of TATY and SAMMY the recent new all-time highs in the price are not being sustained by the same levels of strength favoring demand over supply as was in effect at previous highs. Perhaps the indicators will catch up to the price at some point, but such a rare statistical outlier relative to previous decades remains a conundrum, and a major concern.
This concern is why we are waiting to see TATY begin to paint out lows in, or near the red zone, and tops at, or approaching the blue zone at the 160 level before we can be confident that the March 23 low represented the birth of a strong and vigorous new bull market, as opposed to just another leg up in an aged and fatigued bull trend. Add in record, or near record bullish sentiment, and over valuation exceeding that at the 1929 top, the 1998 and 2000 top in the NYSE (not the NASDAQ), and the 2007 top, and the scales tip in favor of a leg up in an aged bull trend, and in conditions likely to favor volatility as the calendar turns into 2021.
Screenshot-188 shows the negative divergence since the February high through Friday’s close. Please note it not only includes the yawning negative divergence, which developed with the indicator since the February high, but the budding negative divergence over the last couple weeks. Screenshot-189, which is in daily format, shows how the price has been reaching, and attempting to reach, new all-time highs during December. The price in stumbling and ragged action has been intermittently surging to marginal new all-time highs (see up sloping green line on Screenshot-188), as the SAMMY and TATY indicators have been fading lower. This is the kind of indicator behavior, which has preceded corrective action over the decades. Not all such behavior yields corrections, but the percentages are significantly in favor of a period of price weakness developing soon in order to reinvigorate demand at the least, or possibly something even more long lasting and damaging to the price. The depth and duration of any price weakness, which may develop, will need to be monitored closely for acceleration lower, or on the contrary deceleration and bottoming action. For now all we can say is that some of the conditions normally preceding corrective activity are beginning to appear.
Please stay safe and Happy Holidays!