

THE BOTTOM LINE
This week’s update contains some “due diligence” bearish information to aid investors in not becoming complacent due to the seemingly endless bull trend. While the bull trend may continue, evidence of never-before-seen market extremes is accumulating at an alarming rate, implying ever increasing vulnerability to rising volatility. This volatility may be exacerbated by investors, which postponed taking taxable profits in 2021 in favor of cashing out in 2022.
Investors should prepare for a potentially roller coaster stock market in 2022 due to uncertainty surrounding inflation and interest rates, and dangers represented by multiple global geo-political flash points.
Waiting in line for the Roller Coaster
Alexander and I want to wish all our clients and friends a very happy and prosperous New Year!
We are certainly living in an age of hyperbole, but even so the header of the article about a 2022 market crash, which appeared in my email inbox this past week, caught my eye. It appeared to have all the markers of a typical internet promo, but I was surprised to find out that it contained some potentially valuable information, as opposed to the usual “end of the world as we know it” headline “hooks” designed to gather internet “clicks”.
As has been stated here many times, major stock market tops often take weeks, months, or even sometimes years to form, and this tends to lull investors into a false sense of security, because it is human nature to project the recent past into the future. And, after all the bull market just keeps going and going, which reinforces the notion that it will keep on going and going. So bearish clues along the way tend to be ignored, and those holding bearish views are proven wrong and disappointed time and again, and eventually may even be ridiculed for being constantly wrong. There are few things in the world of finance as brutal as being a bear in a bull market. So, today most of the bears out there have lost credibility, and/or are now becoming objects of ridicule.
Here is a stock market quiz question for you: Which major investment house called the stock market tops of 1987, 1990, 1998, 2000 or 2007, or at least one of them? The answer is none, that is right none, even though spending millions of dollars on “research” done by the best and brightest from the Harvard Business School, Wharton, the University of Chicago, or any other prestigious business school you may want to name. Major financial institutions have a vested interest in promoting the “buy and hold” philosophy of investing, which may work if you are fortunate enough to be wealthy young, but may be disastrous to your wealth, if you were retiring in say early 2007 just before the bear market wiped out just short of 60% in the S&P-500, and even more in the NASDAQ.
These days global markets are trying to digest financial extremes, which have never been experienced before, so this implies the potential for market volatility, and price swings of an unprecedented nature. So let us do some “due diligence” and give our clients a briefing outlining just how extreme the current state of the markets has become as gleaned from publications we review, and our own proprietary work. A short list follows.
- Michael Burry, the hedge fund manager upon which the movie “The Big Short” is based has reduced his holdings from more than 20 stocks to just six. He is quoted as saying: “the stock market is on a knife’s edge”. He is also predicting “the mother of all crashes” due to more speculation than the 1920s, and more overvaluation than the 1990s.
- Corporate debt has more than doubled from six trillion dollars to eleven and a half trillion, of which 35% is the worst of the worst junk grade and leading up to the last crisis the percentage was 15%. It is even worse in investment grade where 57% is in the lowest tier of BBB-rated, only one level above junk grade.
- About one in four United States companies cannot afford to pay the interest on their debt, even in this low-rate environment. Corporate debt is at an all-time high at a time when credit quality is at an all-time low, hence the term corporate “zombies”, which have been de facto rescued by the Fed. Even so, trading in “zombie” companies is at record levels. Interest rate increases will likely trigger bankruptcy for many “zombie” companies, and credit downgrades for many other debt laden corporations.
- Inflation will be exacerbated by too much liquidity. The M2 money supply has increase by 40% since the end of 2019, and 26% in just the last year, bubble numbers if there ever have been. Any option available to the Feb to stem the inflation trap would likely result in a recession.
- The real ten-year treasury bond yield after inflation is currently below -5%.
- The S&P-500 is selling at 3 times sales, and the Wilshire 5000 index is at two times GDP, record valuations!
- In the Dot.com era the Nasdaq to S&P-500 volume was 1.3:1 and recently the ratio stood at 2.5, which is an indication of investor willingness to take risks.
- And finally, but may be most concerning is Household Equity Allocation As A Percentage of Financial Assets, which has eclipsed the 2000 record high, which is a fat implied level of risks.
- The normal range for the Rydex Leveraged Bull/Bear ratio 15 years ago was 1.5-2.0 to 1.0. Recently the ratio stood at 62:1 and rising. Additionally, there is record call buying on the option exchanges, and record call premiums, everyone is a bull. Trade volume in leveraged ETFs and Penny Stocks are at records.
- Initial Public Offerings (IPOs) are at record dollar volume highs.
Obviously, these extremes are of concern to risk managers like Alexander and I, but do these mean that a collapse of the stock market is imminent, and the time for action has arrived? The answer to that question is best supplied by a review of the balance of supply and demand as calculated by Lowry Research, and our own proprietary supply and demand-based indicators.
TATY — A REPRESENTATIVE OF A FAMILY OF STRATEGIC SUPPLY AND DEMAND INDICATORS
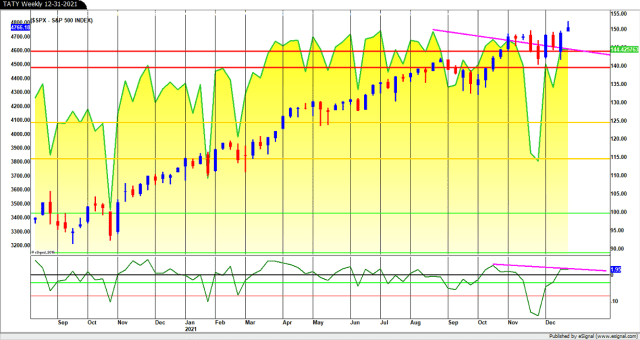
TATY is shown above in yellow with the S&P-500 overlaid in red and blue candle chart format. After visiting the caution zone surrounding the 115-125 level, TATY has rallied back to 144 in the red zone surrounding the 140 level. TATY has now triggered the first requirement for a new “Big Chill” warning, and if TATY cannot continue to gather strength enough to rally above the red zone, then a new “Big Chill” warning may be triggered. A new “Big Chill” warning in the current extreme environment would compel us to consider defensive actions in client portfolios. TATY still has negative divergences in place shown as down sloping magenta lines in the top TATY panel, and the lower Premium/Discount panel.
On the contrary, if TATY begins to oscillate forming bottoms in the red zone and tops near the blue zone surrounding the 160 level, then the bull trend would likely continue in a new bull leg for days, or weeks. The first quarter of 2022 is shaping up as a time for extraordinary vigilance.
SAMMY — A REPRESENTATIVE OF A FAMILY OF TACTICAL SUPPLY AND DEMAND INDICATORS

SAMMY is shown above in yellow with the S&P-500 overlaid in red and blue candle chart format. SAMMY has rallied with the market and has risen above two magenta down sloping negative divergence lines, but remains below its recent high, which was also below its all-time high touched in February 2020. Although improved, SAMMY still casts a shadow on the strength of the rally to new all-time highs.
STERLING — A PROTOTYPE OF A NEW FAMILY OF SHORT TO INTERMEDIATE TERM TRADING INDICATORS UNDERGOING TESTING

STERLING is shown in Screenshot 505 in the top panel with the S&P_500 eMini futures shown in the lower panel. STERLING rallied above a down sloping orange negative divergence line this past week, but left in place a negative divergence with the new all-time price high. So, even though the price spiked to new all-time highs in impulsive fashion, all three supply and demand-based indicators maintained negative divergences with the price, just not as strong as in recent weeks.


Screenshot-506 and 507 are the S&P-500 through Friday’s close in daily and weekly format for your information and perspective. The bull uptrend line remains intact and unbroken, but for now the price has been turned back at the upper resistance line.
Please be safe.
Happy New Year!