

THE BOTTOM LINE
Pundits and some members of the financial media continue to promote the notion that “a peak or terminal interest rate” for this Fed rate raising cycle may loom ahead possibly as soon as the end of this year, and a new bull stock market is emerging in anticipation of the Fed beginning to reduce interest rates. Never mind that this notion is inconsistent with the history of inflation and the historically long cycle of interest rates, which just recently turned up from the terminal extreme of negative rates to complete a 78-year cycle. A new bull market beginning with the lowest unemployment in fifty years, and some say in over seventy years, has that ever happened? Bull stock markets are historically born as the consequence of the chaos and uncertainty of recession and/or depression and high unemployment resulting in the creation of bargain prices for stocks, as opposed to the current situation of record low unemployment, record corporate profits and expensive valuations for stocks.
A leg up in the bear market rally, or perhaps the entire countertrend rally ended after being rejected when TATY, our strategic supply and demand indicator, entered the red zone and then rolled over into a decline. Historically the red zone is “where bear rallies go to die” and at least for the latest leg up that has continued to be the case. Unfortunately, the return of the bear cannot yet be confirmed, because a cohort of other supply and demand indicators like SAMMY and STERLING ended the week positively diverging with the declining price. A close below S&P-500 3764, the December 22nd low, and the disappearance of positive divergences would likely be required to confirm the expiration of the overlapping and time-consuming bear rally, a likely bull imposter like all bear rallies but a really good one given all the “happy talk” and “animal spirits” evident in much of the financial media.
If there is yet another leg up to come it will still be best characterized as the last leg in a countertrend rally, which when complete is likely to result in the resumption of a possibly “large degree” bear market.
IMPOSTER REJECTED
Here is a quote from last week’s update: “Rebound tops during bear markets often expire with the development of negative divergences in a series of our supply and demand indicators, and with our TATY strategic indicator in, or near, the red zone surrounding the 140 level. The price rally did push TATY into the red zone, but the absence of negative divergences suggests the counter trend rally may not yet be done,”. This week the price was rejected after TATY had entered the red zone and the price subsequently began a multi-day decline. However, the decline so far has lacked the kinds of negative internal measurements normally associated with the resumption of a bear decline following the expiration of a bear rally. This leaves open the possibility that the bear rally may still have some unfinished business, especially given the unexpected development of positive divergences in some important supply and demand indicators during Friday’s continuing price decline.
Even if there is yet another leg up to come, after a pause that refreshes, it will still be best characterized as a rally in a bear market. The stock market in its role as master of disguise never allows for our work to be easy.
TATY — A REPRESENTATIVE OF A FAMILY OF STRATEGIC SUPPLY AND DEMAND INDICATORS

TATY is shown above in yellow with the S&P-500 overlaid in red and blue candle chart format. After TATY and the Premium/Discount indicator in the lower panel broke below their respective magenta up sloping support lines, TATY continued to decline below the red zone and finished the week at 132 and above the caution zone surrounding the 115-125 level. The Premium/Discount indicator in the lower panel finished below the zero line but above the horizontal green line at minus five. If the bear rally has expired both should continue to decline until reaching oversold zones from which a price bounce may emerge.
However, TATY did what it does better than any other indicator I’ve found over the decades and signaled the bear rally was likely close to expiring and now it has, at least a leg up of it, hence the notion that the red zone is “where bear rallies go to die”.
SAMMY — A REPRESENTATIVE OF A FAMILY OF TACTICAL SUPPLY AND DEMAND INDICATORS

SAMMY is shown above in yellow with the S&P-500 eMini futures contract shown in green and red candle chart format. Sharp eyed investors will notice that this recent bear market rally was stronger vis-à-vis SAMMY than at the January 5th, 2022 all-time high, when the forces driving the price to that all-time high were waning and negatively diverging, as stock after stock was peeling away into their individual bear trends, and the cap-weighted indexes were staggering toward their all-time highs.
SAMMY remains above its dashed red horizontal previous resistance line, which once broken became support. This implies the potential existence of enough residual demand to power another leg up in the bear rally after a “pause which refreshes”. Please also notice that SAMMY finished the week with a positive divergence, shown as an up sloping green line, to the declining price. While the bear rally may have already ended and an accelerating decline lies ahead as the calendar turns toward spring, investors should not be surprised if the “master of disguise and deceit”, which is the stock market, surprises the bears with another rally attempt. If that were to happen with big negative divergences in place in a cohort of supply and demand indicators, then all the better for the bear rally expiration to arrive in a more classic fashion.
STERLING — A REPRESENTATIVE OF A FAMILY OF NEW SHORT TO INTERMEDIATE TERM TRADING INDICATOR UNDERGOING TESTING

STERLING is shown above in the upper panel with the S&P-500 eMini futures contract in the lower panel. The dashed upsloping green support line on the STERLING chart stands in sharp contrast to the declining price in the lower panel shown with a red dashed down sloping line. STERLING has an enviable record at developing meaningful divergences in advance of trend changes. In this case the developing positive divergence in STERLING may be suggesting the price decline may only be a pause before another leg up in the bear rally.

Screenshots-1157 (above) and 1158 (below) are weekly charts of the S&P-500 eMini futures and cash index, respectively. These are updated through Friday’s close for your additional information and perspective. In both cases if there is another leg up to come in this time consuming and overlapping bear rally, then investors may expect the rally to encounter some significant resistance as the price approaches the red dashed horizontal resistance lines.

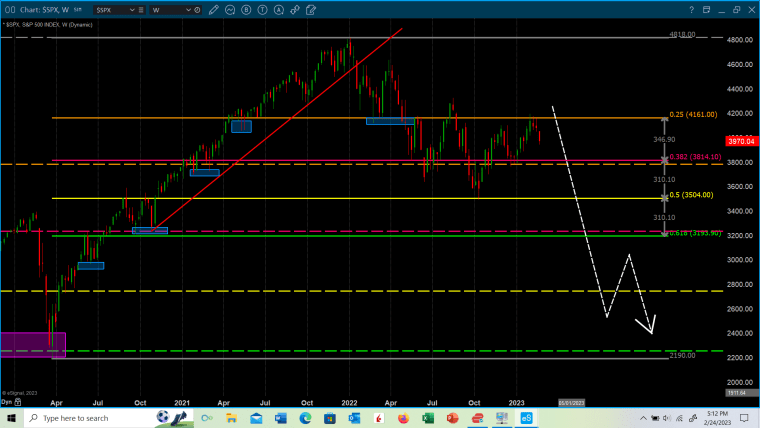
Screenshot-1159 (below) has been shown often in these weekly updates and is updated through Friday’s close. The bear market rally may be complete, and if it is then the price will continue to work lower. However, if there is yet another bear rally leg up to come, then the odds still favor a resumption of the bear market once the countertrend rally is complete, possibly along the lines of the crudely drawn in decline represented by the dashed white lines. The white dashed lines are for illustrative purposes only and are not intended to be definitive, and of course there are other paths any further bear decline may take, which may also be valid.
As additional information, if another bear market leg up does develop over a year past the January 5th all-time high at S&P-500 4818, then investors should be made aware that some analysts may consider such an event as additional potential evidence that the stock market may be painting out a “large degree” and time consuming bear market in like manner as the onset of the emerging new interest rate (debt) cycle, where the completion of the most recent cycle unfolded as thirty-nine years of rising rates followed by thirty-nine years of declining rates finally terminating in negative rates, for a total of seventy-eight years round trip.
DISCLAIMER : Optimist Capital LLC, does not guarantee the accuracy and completeness of this report, nor is any liability assumed for any loss that may result from reliance by any person upon such information. The information and opinions contained herein are subject to change without notice and are for general information only. The data used for this report is from sources deemed to be reliable, but is not guaranteed for accuracy. Past performance is not a guide or guarantee of future performance. Optimist Capital LLC, and any third-party data providers, shall not have any liability for any loss sustained by anyone who relied on this publication’s contents, which is provided “as is.” Optimist Capital LLC disclaim any and all express or implied warranties, including, but not limited to, any warranties of merchantability, suitability or fitness for a particular purpose or use. Our data and opinions may not be updated as views or information change. Using any graph, chart, formula or other device to assist in deciding which securities to trade or when to trade them presents many difficulties and their effectiveness has significant limitations, including that prior patterns may not repeat themselves continuously or on any particular occasion. In addition, market participants using such devices can impact the market in a way that changes the effectiveness of such device. The information contained in this report may not be published, broadcast, re-written, or otherwise distributed without prior written consent from Optimist Capital LLC.