

THE BOTTOM LINE
The slow moving and overlapping countertrend rally continued to frustrate both bulls and bears alike this past week. It appears that confirmation of resurging and soaring demand followed by a breakout above S&P-500 4300 may be required for the bull case to gain credibility, or on the contrary the development of negative divergences during another rally attempt followed by a plunge lower in a cohort of supply and demand indicators, and then a close below S&P-500 4045 may be required in order for the bears to regain control of the stock market, otherwise the price may continue to remain range bound.
A violation of S&P-500 4045 on a closing basis may lead to an accelerating decline, which would almost certainly confirm the bear rally expired at the early February rebound high marginally below S&P-500 4200 and marginally above 4200 basis the S&P-500 eMini futures contract.
In closing, the inverted yield curve touched a new extreme this past week, which continues to makes the near risk free yield on T-bills very attractive versus the risk adjusted one hundred plus year average return in equities. So, until this changes we will likely remain under invested in equities in favor of rolling over three to six month T-bills with yields climbing toward five percent. Inverted yield curves are often harbingers of recession, and recessions often ferret out previously unknown weaknesses in the financial system, which makes T-bills even more attractive vis-à-vis prudent risk management.
JURY IS STILL OUT
Here is a quote from last week’s update, which is still valid: “If the bear rally has expired, then frustration on the part of the bulls at yet another rally failure may result in some acceleration lower. Otherwise with some supply and demand indicators already reaching oversold zones on their daily charts the current dip may give rise to another rally leg in the absence of any negative divergences at the top to date off the October low. I would much prefer to see another rally attempt with a cohort of supply and demand indicators peeling away into dramatic negative divergences. This outcome would be a more definitive expiration of the bear market rally on fatigued and exhausted buyers, and if that happened approaching the overhead resistance surrounding S&P-500 4300, the July rebound top, then all the better”.
The stock market has continued to frustrate bulls and bears alike as it has vacillated range bound for over two weeks, even as many pundits continue to discount forward the end of inflation and the beginning of the Fed as a friend psychology, because the lowering of interest rates would almost surely follow. Never mind the history of inflation does not support such an improbable outcome, even in an “instant gratification” society such as our own.
Rebound tops during bear markets often expire with the development of negative divergences in a series of our supply and demand indicators, and with our TATY strategic indicator in, or near, the red zone surrounding the 140 level. The price rally did push TATY into the red zone, but the absence of negative divergences suggests the counter trend rally may not yet be done, hence the quote above from last week’s update.
TATY — A REPRESENTATIVE OF A FAMILY OF STRATEGIC SUPPLY AND DEMAND INDICATORS

TATY is shown above in yellow with the S&P-500 overlaid in red and blue candle chart format. TATY finished the week marginally below the red zone surrounding the 140 level at 137.
If the rebound rally has expired, then TATY will continue to decline into the caution zone surrounding the 115-125 level, and the Premium/Discount indicator in the lower panel will likely continue to decline toward the minus five, then minus eight level before becoming oversold enough for another rally attempt. As stated in the quote from last week highlighted above, the best outcome in this situation would be for TATY to form a significant negative divergence as the price rally attempts to assault the rebound rally high made on the second of February off the December 22nd low, because the Friday intraday violation of a key price support at approximately S&P-500 4060.00 has not yet resulted in any acceleration lower.
SAMMY — A REPRESENTATIVE OF A FAMILY OF TACTICAL SUPPLY AND DEMAND INDICATORS

SAMMY is shown above in yellow with the S&P-500 eMini futures contract overlaid shown in red and green candle chart format. SAMMY has declined below its up-sloping magenta support line but has held above its dashed red horizontal long-term resistance, now support line (resistance once broken becomes support). This suggests another rally attempt otherwise SAMMY would have continued to decline below the former resistance, but now red dashed horizontal support line. A price rally with a developing negative divergence in SAMMY would strongly suggest the bear market rally may finally be approaching expiration as discussed in the quote from last week’s update.
STERLING — A REPRESENTATIVE OF A NEW FAMILY OF SHORT TO INTERMEDIATE TERM TRADING INDICATORS
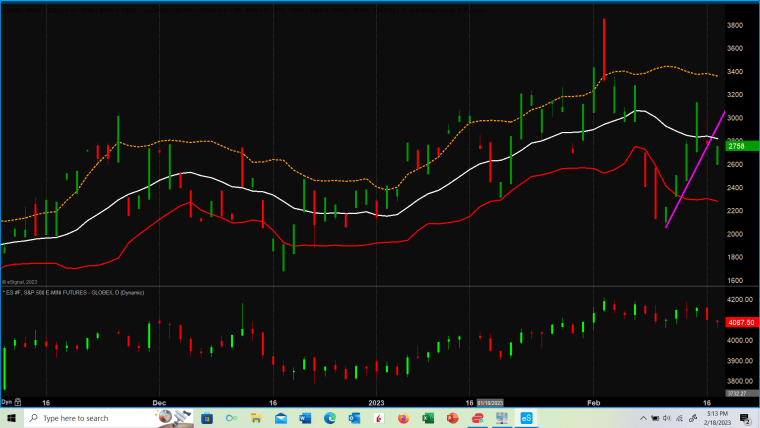
STERLING is shown above in the upper panel with the S&P-500 eMini futures contract in the lower panel. STERLING has broken below its magenta up sloping support line, but like TATY and SAMMY did not develop a negative divergence before this decline began. STERLING tends to be a superior divergence forming indicator, so the lack of a negative divergence before this decline began suggests the bear rally may have unfinished business before rolling back over into another leg down in a continuing bear market decline.
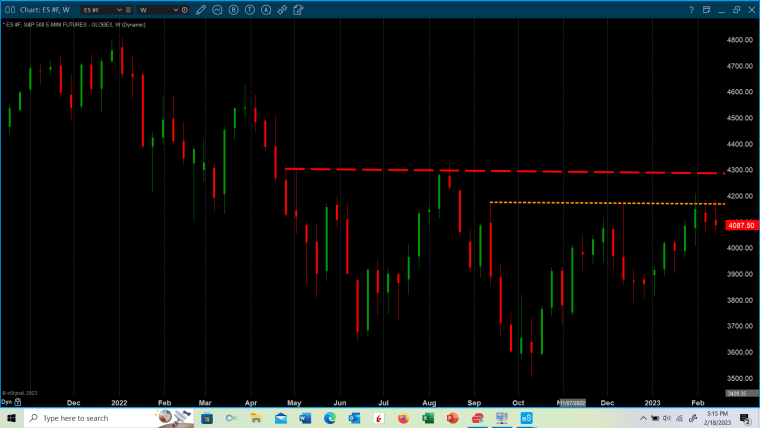
Screenshots 1152 (above) and 1153 (below) are the S&P-500 eMini futures and cash index respectively, which have been updated through Friday’s close. If the lack of negative divergences at the early February rebound high implies that enough residual demand may exist to result in another rally attempt, then the overhead resistance represented by the dashed red horizontal line on both charts may come into play. If such a rally does occur with a cohort of supply and demand indicators not confirming the rally by rolling over and negatively diverging with the rally, then the slow moving, overlapping, and frustrating countertrend rally may finally be expiring, especially if TATY declines into the caution zone and SAMMY violates its red horizontal dashed long term resistance line, which is now support.

Screenshot-1154 (below) has been shown and explained many times in these weekly updates and is updated here through Friday’s close for your additional information and perspective.

DISCLAIMER : Optimist Capital LLC, does not guarantee the accuracy and completeness of this report, nor is any liability assumed for any loss that may result from reliance by any person upon such information. The information and opinions contained herein are subject to change without notice and are for general information only. The data used for this report is from sources deemed to be reliable, but is not guaranteed for accuracy. Past performance is not a guide or guarantee of future performance. Optimist Capital LLC, and any third-party data providers, shall not have any liability for any loss sustained by anyone who relied on this publication’s contents, which is provided “as is.” Optimist Capital LLC disclaim any and all express or implied warranties, including, but not limited to, any warranties of merchantability, suitability or fitness for a particular purpose or use. Our data and opinions may not be updated as views or information change. Using any graph, chart, formula or other device to assist in deciding which securities to trade or when to trade them presents many difficulties and their effectiveness has significant limitations, including that prior patterns may not repeat themselves continuously or on any particular occasion. In addition, market participants using such devices can impact the market in a way that changes the effectiveness of such device. The information contained in this report may not be published, broadcast, re-written, or otherwise distributed without prior written consent from Optimist Capital LLC.