

THE BOTTOM LINE
In 2020, and so far in 2021, we have been confronted with unprecedented situations in the economy, and the stock market. Norms and risk guidelines of long standing have been shattered by tidal waves of massive debt and corresponding liquidity not seen since the dark days of WWII. And, even though giddy euphoric sentiment is evident on numerous metrics, and investors are willing to pay obscene prices for stocks, 2.98 dollars for every dollar of sales on average for example, the bull trend has continued. However, over the last several days some immature evidence has arrived of a factor contributing to the February 2020 then all-time high, and the September 2020 then all-time high, both of which were followed by painful corrections, and in the February 2020 event the quickest decline into a bear market in history. That missing link evidence is the budding development of negative divergences in SAMMY and CAROLINE LEIGHTON, with hints that STERLING may also join by developing a negative divergence by the end of next week.
As John Maynard Keynes correctly observed: “Markets can remain irrational longer than you can remain solvent”, so this early on these budding divergences only bear watching, but should they begin to mature as the price begins to struggle higher, then defensive action may be required. The traditionally positive stock market seasonal expired on Easter, and we have entered what is seasonally a challenging period for stocks. So, investors should not be surprised, if the summer and fall may be quite a different environment for stocks than the one enjoyed since Halloween of 2020.
Given the expensive and challenging conditions facing risk managers, we are scouting out unique opportunities, which may still reward in a grossly over-valued stock market. We have taken an initial position in an emerging trend in AV and EV with an ETF, which is a universal play on both. And, we are investigating other opportunities as well, which we will outline to clients, if we decided to add any to portfolios.
The Missing Link
Several times over the last few weeks we have mentioned the extremes posted by various measures of bullish sentiment, and historic over-valuation as investors have driven the price of stocks ever higher, as global markets are awash with liquidity looking for a home, where it may be treated best. Apparently even seasoned investors, which should know better, have chosen to ignore the rules of prudent investing and risk management, as anticipation of yet even more stimulus, and liquidity flooding the financial system has convinced them that “it is different this time”, and it may be, but that is yet to be proven.
Today I want to take another look at the last two significant tops, which appeared out of this same type of environment of giddy, even euphoric bullish sentiment, and historic over-valuation, both of which are very blunt market tools. Contrary investment theory holds that when most investors are bullish there are few, or no investors left to drive prices higher, and on the contrary when most investors are bearish there a few left to drive prices lower. The passage of the Trump tax cuts contributed to causing bullish sentiment to reach well into the range normally associated with danger in the stock market.
The return of the Democrats to power, no matter how thin their majority in the Congress, has driven bullish sentiment into a financial orbit somewhere beyond Pluto in anticipation that at least some of their highly stimulative agenda will become law, and the knowledge even among Republican investors, by far the majority on Wall Street, that the stock market tends to do well when the Democrats are in power. So the table has been set for the violation of the norms of prudent investing and risk management, and it is happening as the relentless rally off the March 23, 2020 low continues in baby steps ever higher.
So how long can this rally continue before at least a pause to reinvigorate demand, or even a correction scary enough to drive the amateur, novice or unsophisticated would-be investor from the stock market, a necessary process in order for bull trends to sustain themselves. This is called in the trade the transference of wealth from weak hands to strong. Over the last several days a missing factor, which appeared just before the February 2020 then all-time high, and the more recent September all-time high, which gave way to an eleven percent decline, has begun to develop in some tactical supply and demand indicators. For more on this missing piece of the potential topping puzzle read on.
TATY — A REPRESENTATIVE OF A FAMILY OF STRATEGIC SUPPLY AND DEMAND INDICATORS

TATY is shown above in Snapshot-271 in yellow with the S&P-500 overlaid in red and blue candle chart format. TATY finished the week at 147 above the red zone. If TATY begins to paint out bottoms in the red zone and tops approaching the blue zone at the 160 level, then the odds of the bull trend continuing for weeks, or months will increase significantly, and will imply that the March 23, 2020 low put in place a strong foundation for a continuing bull market. However, a decline by TATY back into the caution zone surrounding the 115-125 level would cast a shadow on the continuing bull market notion, and potentially be an early warning that the latest leg up in the rally off the March 23, 2020 low was probably coming to an end.
At this point TATY must begin to accelerate higher, and then start painting out bottoms in, or near the red zone surrounding the 140 level, or it may begin to fade and begin to paint out the necessary steps in another “Big Chill” warning by dipping into the caution zone, and then rallying only to be turned back in, or near the red zone. A “Big Chill” warning in a giddy with euphoria environment, and obscene over-valuation, would be a significant development demanding caution, and adherence to prudent risk management. While this is happening, our tactical supply and demand indicators must be watched carefully for further developments in the missing link situation. A discussion of the heretofore missing link follows in the tactical indicator section below.
SAMMY — A REPRESENTATIVE OF A FAMILY OF TACTICAL SUPPLY AND DEMAND INDICATORS

SAMMY is shown above in weekly format in Screenshot-220 in with the S&P-500 overlaid in red and blue candle chart format. The chart still has the recent divergent and resistance lines drawn in as they have been in recent weeks. Even though the price has consistently been touching new all-time highs the negative divergence with the strength in evidence at the February 2020 top remains in evidence, as depicted by the down sloping dashed orange line, and the more severe down sloping magenta dashed line, which appeared immediately before the record swift plunge from February to March 2020 to 38% down off a new all-time high in only 27 days. Sharp eyed investors will notice that over the last couple weeks SAMMY has begun to fade a bit as the price has been touching new all-time highs.

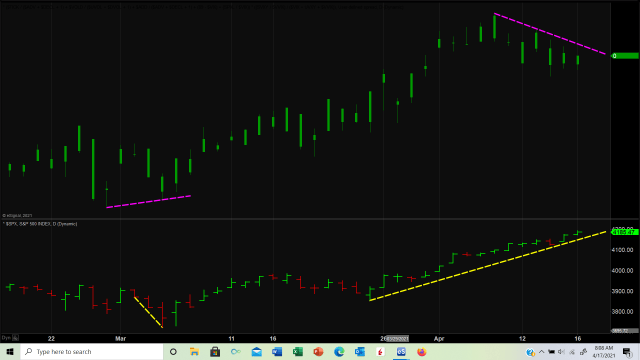
Screenshot-221 shows CAROLINE LEIGHTON in weekly format, top panel, with a less than mature down sloping magenta dashed line representing a developing negative divergence with the price shown in the bottom panel with an up sloping yellow dashed line. A two week negative divergence would not normally attract much attention, but given the levels of bullish sentiment and over-valuation, then nothing should be discounted as not being significant.

Screenshots 223 (above) and 224 (below) respectively show the budding negative divergences in more daily detail, first in SAMMY and then CAROLINE LEIGHTON. And, I am suspicious that by the end of next week STERLING, not shown, may join SAMMY and CAROLINE LEIGHTON with a developing negative divergence. So, while excessive bullish sentiment and gross over-valuation have not yet yielded any kind of serious weakness, which is to be expected when utilizing such blunt instruments, but is not any reason to ignore what they imply.
So what does it all mean? Well investors should not be surprised if the bulls attempt more assaults on new all-time highs, but implied risks will be accumulating, if the price continues to probe new all-time highs, as multiple tactical indicators develop more mature negative divergences, and should the strategic indicator TATY fail to accelerate higher, and fail to begin to paint out bottoms in the red zone. The appearance in such an environment of a new “Big Chill” warning could be potentially the equivalent of a three alarm fire for the stock market. The market is not there yet, and may not go there, but it is not too soon to alert our clients and research customers that this kind of setup, or one similar, is on our risk management radar.
Please stay safe!
DISCLAIMER : Optimist Capital LLC, does not guarantee the accuracy and completeness of this report, nor is any liability assumed for any loss that may result from reliance by any person upon such information. The information and opinions contained herein are subject to change without notice and are for general information only. The data used for this report is from sources deemed to be reliable, but is not guaranteed for accuracy. Past performance is not a guide or guarantee of future performance. Optimist Capital LLC, and any third-party data providers, shall not have any liability for any loss sustained by anyone who relied on this publication’s contents, which is provided “as is.” Optimist Capital LLC disclaim any and all express or implied warranties, including, but not limited to, any warranties of merchantability, suitability or fitness for a particular purpose or use. Our data and opinions may not be updated as views or information change. Using any graph, chart, formula or other device to assist in deciding which securities to trade or when to trade them presents many difficulties and their effectiveness has significant limitations, including that prior patterns may not repeat themselves continuously or on any particular occasion. In addition, market participants using such devices can impact the market in a way that changes the effectiveness of such device. The information contained in this report may not be published, broadcast, re-written, or otherwise distributed without prior written consent from Optimist Capital LLC.