

THE BOTTOM LINE
The bear rally has done what bear rallies have always done, which is to trick investors into a false sense of a return to normalcy and that the danger has passed. TATY, on the contrary, has just completed the necessary steps for a new “Big Chill” warning, which has an enviable record of consistently warning of major tops during bull markets, and the imminent demise of countertrend rallies during bear markets. The stock market is a master of disguise, and bear markets are insidious masters of both disguise and deceit, so who are you going to trust, the legions of (mostly young) analysts on the financial media, which have never navigated a rising rate environment, or a collection of emotionless objective supply and demand indicators calculated from data generated only by the market itself, which have an enviable and outstanding record of accuracy?
While the price may linger near the highs for the rally off the June low to date, or even perhaps assault the next Fibonacci target at S&P-500 4366, investors should be prepared for the return of volatility as a potentially large degree bear reasserts its power, and perhaps in dramatic fashion.
BIG CHILL WARNING
This week’s update will be brief for a very good reason, which is the weight of the evidence is now growing stronger that the first countertrend rally in a potentially large degree bear market is approaching its terminus, possibly before or not long after the Labor Day holiday. The rally has done its job of turning investors optimistic toward levels approaching giddy with excitement that the bear market ended on June 17th at S&P-500 3636, even though the classic signs of panic and capitulation were not present at that low, and other signs that the bear market had ended have been mixed at best as the persistent rally developed, including in a number of Lowry Research indicators, but even so Lowry has not advised subscribers to initiate a scaled buying program during the interim following the June 17th low, as the weight of the evidence has not yet justified the implementation of that classic Lowry strategy.
TATY — A REPRESENTATIVE OF A FAMILY OF STRATEGIC SUPPLY AND DEMAND INDICATORS

TATY is shown above with the S&P-500 overlaid in red and blue candle chart format and closed the week at 133 after having closed the previous week in the red zone surrounding the 140 level, which has now triggered a new “Big Chill” warning.
Recent updates have advised investors that TATY may issue a “Big Chill” warning having made an excursion into the caution zone surrounding the 115-125 level and rebounding back into the red zone surrounding the 140 level, a zone where bear market countertrend rallies of the past have consistently gone to expire. And, this week TATY faltered and then closed below the red zone completing the necessary requirements for a new “Big Chill” warning, which raises the odds substantially that the price will likely begin to weaken and eventually follow TATY lower.
Investors will notice that TATY has a very consistent behavior regarding divergences, both positive and negative. TATY and its Premium/Discount indicator shown in the lower panel of TATY developed huge positive divergences prior to the June S&P-500 low at 3636 (up sloping green and blue lines) as the price was still declining into the June low (down sloping red line). This was noted in my June 19th weekly update BOTTOM LINE: The popular stock indexes declined over four percent this past week and touched new lows for the bear market to date while generating multiple 90% downside days. In the process of making new lows the stock market has become oversold and some key supply and demand indicators are now positively diverging with the declining price, which suggests some restraint upon any further decline during this leg down off the all-time high, and/or a soon to develop countertrend rally of unknown strength and duration. However, exhausted sellers are not sufficient alone to bring an end to a bear market. New bull markets require evidence of exhausted sellers usually in the form of a series of 90% downside days and evidence of strong and resurging demand. Lacking this evidence, we shall continue to treat the stock market as being in a bear market requiring ongoing defense in client portfolios.
While not all “Big Chill” warnings may turn out to be harbingers of major tops, or rebound tops during bear market rallies, from inception to date the record of this TATY indicator’s early prototypes dating to the late 1980s is outstanding relative to any other top warning indicator I’ve ever known or investigated. Calling major tops, or rebound tops during bear market rallies, is among the most difficult exercises in stock market analysis. So, now we have another iteration of this “Big Chill” signal, and we will take it at face value and remain vigilant for a return of volatility and the next chapter in what is likely a potentially large degree bear market.
SAMMY — A REPRESENTATIVE OF A FAMILY OF TACTICAL SUPPLY AND DEMAND INDICATORS

SAMMY is shown above in yellow with the S&P-500 eMini futures overlaid in red and green candle chart format.
After soaring above its magenta dashed negative down sloping divergence line, SAMMY has now confirmed the weakness being exhibited in TATY by being rejected at its horizontal dashed red long term resistance line. This implies a more labored price movement higher, or possibly the imminent expiration of the bear rally. However, as we shall see in the STERLING section, the price may loiter, or drift toward the 62% Fibonacci level at 4366 before the weakening of TATY and SAMMY spreads to the price. If so, this would align the next leg down in the price with the historically weakest months of the seasonal year, September, and October.
STERLING — A REPRESENTATIVE OF A NEW FAMILY OF SHORT TO INTERMEDIATE TERM TRADING INDICATORS UNDERGOING TESTING

STERLING is shown above in the top panel with the S&P-500 eMini futures in the lower panel. STERLING tends to be remarkably consistent in developing divergences, both positive and negative, at bottoms and tops, respectively. However, even though TATY and SAMMY are now in positions, which almost always results in price weakness, the lack of a negative divergence in STERLING suggests the price may linger near recent rebound highs, or perhaps even drift higher toward the next Fibonacci target, which is the 62% level at S&P-500 4366, while STERLING puts in place a negative divergence with the higher drifting price. This is not required, but something which investors need to be aware may happen.

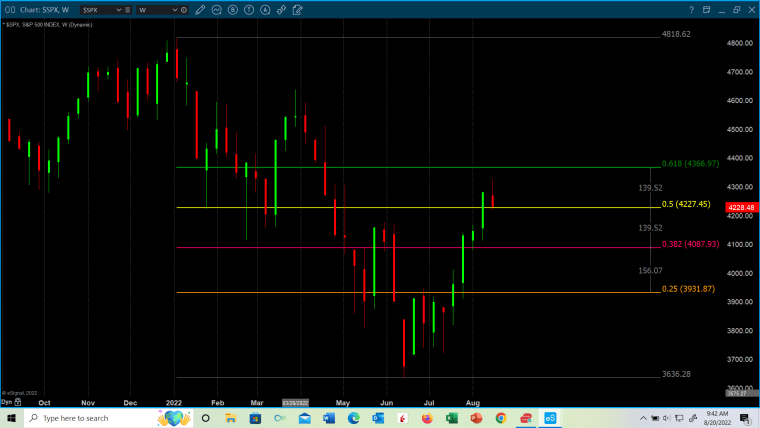
Screenshot-947, 948 (both above) and 949 (below) have all been shown before, so no comment is required as a briefing on their meaning and are included for your additional information and perspective. Screenshot-947 shows previous support having been broken as current resistance. Screenshot-948 shows the remaining Fibonacci target at 4366, and Screenshot-949 two Fibonacci target grids generated from two different previous significant lows, the March 2009 low at S&P-500 666 and the March 2020 low at 2190. If the current bear rally is ending, then investors should brace for one, or more of the lower Fibonacci and/or horizontal blue support zone targets to come into play. A breach on a closing basis of 2190, the March 2020 low, would confirm the existence of a bear market of a very large unknown and devasting degree with huge negative social, economic, political, and geopolitical implications we do not even want to contemplate. Think Category 6 if it were a hurricane.

DISCLAIMER : Optimist Capital LLC, does not guarantee the accuracy and completeness of this report, nor is any liability assumed for any loss that may result from reliance by any person upon such information. The information and opinions contained herein are subject to change without notice and are for general information only. The data used for this report is from sources deemed to be reliable, but is not guaranteed for accuracy. Past performance is not a guide or guarantee of future performance. Optimist Capital LLC, and any third-party data providers, shall not have any liability for any loss sustained by anyone who relied on this publication’s contents, which is provided “as is.” Optimist Capital LLC disclaim any and all express or implied warranties, including, but not limited to, any warranties of merchantability, suitability or fitness for a particular purpose or use. Our data and opinions may not be updated as views or information change. Using any graph, chart, formula or other device to assist in deciding which securities to trade or when to trade them presents many difficulties and their effectiveness has significant limitations, including that prior patterns may not repeat themselves continuously or on any particular occasion. In addition, market participants using such devices can impact the market in a way that changes the effectiveness of such device. The information contained in this report may not be published, broadcast, re-written, or otherwise distributed without prior written consent from Optimist Capital LLC.