

THE BOTTOM LINE
A series of lower lows and lower highs remain intact following the January 4th all-time high at 4818 in the S&P-500, which is the definition of a downtrend. And, the weight of the evidence remains marginally in favor of the current countertrend rally being only a bounce in an ongoing initial leg down in an emerging bear market potentially of very large degree and duration. However, the countertrend rally is now mature enough to begin to tilt the odds in favor of a bounce, or multi-week corrective rally most likely before the calendar turns to August. Lacking evidence of gathering strength emerging soon, then investors should not be surprised by a resumption of the bear decline, and perhaps an acceleration lower in an environment of potentially very high volatility. We shall continue to maintain our defensive positions in portfolios until the countertrend rally debate is decided.
Bounce?
The stock market, in its role as a master of disguise, managed to get through the holiday shortened week without telegraphing whether the initial leg down in the new bear market was complete or still ongoing. The former would imply the current countertrend rally was just part of a larger movement, which would eventually, likely over a period of weeks, “correct” the completed first leg down in a nascent bear market. And, the latter would imply a nearly complete bounce, which may linger for a period of days. However, given the clear series of lower lows and lower highs in place since the January 4th S&P-500 all-time high at 4818 both probable outcomes are rallies in a bear market, which is potentially of a very large “degree”. Three out of the four days of the holiday shortened week the advance/decline line was negative, so for the time being advantage bounce in a yet to be completed initial leg down in a budding bear market.
TATY — A REPRESENTATIVE OF A FAMILY OF STRATEGIC SUPPLY AND DEMAND INDICATORS

TATY is shown above in yellow with the S&P-500 overlaid in red and blue candle chart format. TATY finished the week at an oversold 128, but marginally above the caution zone surrounding the 115-125 level. TATY began to negatively diverge with the rising and all-time touching price back in August and has been negatively diverging ever since, as the price experienced its worst start to a new year in fifty years, in a trend which threatens to get even worse late or soon, as TATY appears to be weakening rather than gathering strength. TATY is suggesting resolution of the question of which bear rally is in place may be decided in a matter of days. Should TATY fall back into the caution zone, or lower, then the weight of the evidence would increase in favor of a bounce in a yet to be completed first leg down in an emerging bear market.
SAMMY — A REPRESENTATIVE OF A FAMILY OF TACTICAL SUPPLY AND DEMAND INDICATORS

SAMMY is shown above in yellow with the S&P-500 overlaid in red and green candle chart format. SAMMY finished the week at 29, which is the highest level so far in 2022, but still below the dashed magenta negative divergence line dating to last fall. A strong rally above this negative divergence line would be evidence of surging demand and if this evidence were to spread to other indicators the weight of the evidence may begin to favor a prolonged countertrend rally, which in turn may suggest the odds may be turning in favor of the completed first leg down in an emerging bear market option. So, for now we will just take the current weight of the evidence at face value and expect a weakening rally in the immediate days ahead, which would suggest a resumption of the bear trend in a matter of days as opposed to weeks. Please remember the stock market is a game of probabilities and risk management and not certainty, so we shall be vigilant for evidence of shifting probabilities, which are currently marginally in favor of a bounce perhaps nearing an end.
STERLING — A FAMILY OF SHORT TO INTERMEDIATE TERM TRADING INDICATORS UNDERGOING TESTING

STERLING is shown above in the top panel with the S&P-500 eMini futures contract in the lower. STERLING atypically has not developed a divergence, positive or negative since mid-May so for now STERLING is a non-factor in the bounce versus multi-week rally debate. This is subject to change, especially if the countertrend rally is drawing closer to an end as was suggested by the negative advance/decline line of this past week.

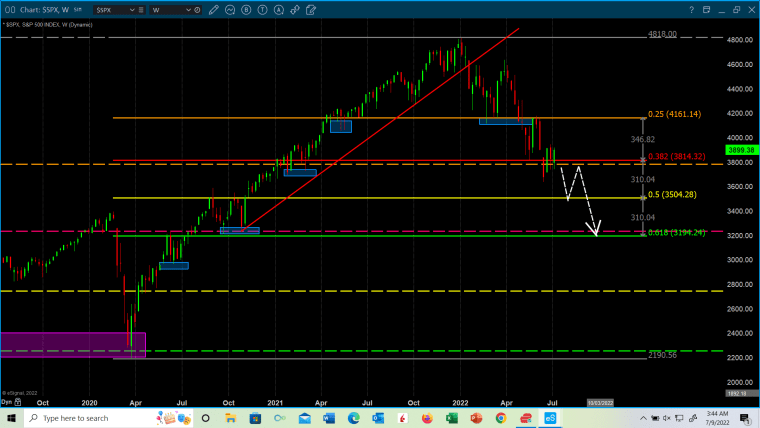
Screenshots-912 (Above) and 913 (Below) are for your additional information and perspective updated through Friday’s close. Screenshot-913 shows two Fibonacci projections, one beginning at the March 23, 2020 low at approximately S&P-500 2190, and another from the March 9, 2009 low at S&P-500 666. The color coding for retracement levels is the same for both, respectively, which is orange 25%, red 38%, yellow 50% and green 62%. And the blue horizontal rectangles are zones of potential support created during the long rally to the all-time S&P-500 high at 4818. If 2190 is never violated on a closing basis for the remainder of this bear market, then the larger “degree” bull market will still be in effect and ongoing, and a new bull leg up will be due to begin following the final low for the “normal” 18–24-month bear market so often referenced and promoted by the big brokerage houses.
However, if S&P-500 2190 is violated on a closing basis, then investors will likely find themselves in the worst equity bear market of their lifetimes, because violation of 2190, in our view, would suggest confirmation of the existence of an ongoing bear market of an unknown very large “degree” and duration with social, economic, political, and geopolitical implications of similar scale and intensity. Unfortunately, this time around the bond market may not represent a safe place to hide, as the bonds have completed a 78-year cycle, 39 up years for rates followed by 39 down years, which ended in global negative yields. This means the bond market has entered a bear market and investors fleeing a declining equity asset environment would only be running into another declining asset class. So, this notion of “degree” of trend has a lot riding on it, if that S&P-500 key 2190 level is violated. Hopefully, this just turns out to be an academic exercise, but given the historic extremes coincident with the all-time high, then there are ample reasons to examine this behavioral finance notion of “degree” of trend and have our clients briefed well in advance of any manifestation of it.